Selling additional products or services usually sounds like a good thing, but that’s only true when every extra sale contributes to your overall bottom line. Unfortunately, keeping track of those numbers can get a little complicated.
Marginal revenue can help by showing exactly how much additional income your business brings in from selling one more unit. When compared to other metrics like production or support costs, it can become a powerful tool for making pricing decisions, evaluating discount strategies, and planning for scale.
In this article, we’ll take a closer look at marginal revenue from both a theoretical and practical perspective so that you can use it to grow your profitability.
What is marginal revenue?
Marginal revenue (MR) is the revenue added by your last sale of a product or service. This metric is always focused on the last unit sold and the revenue generated when that product/service is transacted.
Marginal revenue example
Example: If you sell a pair of shoes for $50 and you sell one more unit, also at $50, your marginal revenue for that extra unit is $50.
While the concept is straightforward, the way marginal revenue is used varies depending on whether you’re looking at it in theoretical terms or trying to apply it to a real-world business situation.
Marginal revenue in theory
In microeconomics, MR is typically used to understand how revenue changes as output increases. This varies greatly depending on the type of marketplace that the business operates in.
- In a perfectly competitive market model, every seller offers the same product, and no single seller can influence price. All units are sold at the going market rate, and there’s no flexibility to charge more or less. In this model, marginal revenue is always equal to market price and remains constant.
- In an imperfect marketplace model, sellers have some control over pricing. However, economic theory assumes that, to increase quantity sold, a business must lower the price. That price reduction applies to all units sold.
If both of these scenarios sound counterintuitive to how businesses actually operate, you’re not wrong. But let’s stick with the theory for just a moment.
Imperfect marketplaces more closely resemble a real-world scenario, but they’re still well off the mark. Economic theory makes the assumption that you can only charge one price at a time for all units because products are identical, everyone has perfect information, and price discrimination isn’t allowed.
In other words, buyers all pay the same rate, or they walk away.
In this theoretical bubble, market saturation is reached when all buyers who are willing to pay that price have made their purchase. In order to capture a greater market share, businesses need to lower their price to make a product more accessible and attractive to a greater selection of customers.
Following that framework, you’ll get something like this:
Example: You’ve sold 10 units of shoes at $100 each. However, if you want to sell 11 units, you’ll need to lower the price to $98, bringing your revenue to $1,078—not $1,098—because all 11 units must be sold at the same price.
Why does MR function this way when used in theory?
Because theoretical MR is trying to answer the question: What if I sold one more unit of my product or service? The theory assumes that all sales generate the same revenue. In the example above, you’re either selling 10 units for $100 or 11 units for $98.
The result is a curve that shows each additional unit bringing in a little less overall revenue than the ones before it, which aligns with the standard marginal revenue formula:
MR = (Change in Total Revenue) / (Change in Quantity Sold)
This type of theoretical modeling is meant to help economists explain downward-sloping demand curves and revenue behavior in imperfect markets. By applying the lower price to all units, marginal revenue decreases as you sell more because you’ll need to lower the price in order to move more products. This is the marginal revenue curve, which always slopes downward as a greater number of units are sold for additional revenue at a lower product price.
But remember, everything we’ve covered so far is purely theoretical. Marginal revenue, when exposed to real-world scenarios, breaks down quickly as a standalone metric.
Marginal revenue in practice
In the real world, MR works differently than it does in economic models.
Businesses don’t typically lower the price of all units just to sell one more. All buyers won’t pay the same rate to acquire a product. Pricing strategies are more flexible, segmented, and often customized based on volume, customer type, or market conditions.
All of this means that, in practice, marginal revenue is usually the revenue generated by the most recent sale rather than a blend of prices across all units.
Example: A business sells 10 pairs of shoes for $100, then offers a $10 discount on the 11th pair in order to close the deal.
In this real-world scenario, the marginal revenue is $90. The first ten units still earned $100 apiece. Changing the price of the last unit doesn’t retroactively alter their value.
Unlike theoretical models, most businesses are also capable of price discrimination, meaning that prices are charged to different customers based on their willingness to pay, their order size, or their relationship with the business. Additionally, earned revenue may vary wildly over various sales channels, further complicating this issue.
However, in a realistic scenario, marginal revenue also becomes a more practical, tactical metric. When calculated and applied correctly, MR can tell you any of the following:
- How much revenue is each additional sale bringing in?
- Are we maintaining profitable unit economics as volume increases?
- Do our sales justify our production, shipping, or fulfillment costs?
- Is a discount necessary, or should we stop offering the product at all?
Marginal revenue becomes especially useful when pricing isn’t fixed or when product delivery has variable costs. This is common in industries like SaaS, healthcare, and manufacturing, which is why many of these industries rely on CPQ software to keep all variables straight. This information can help teams evaluate whether sales are worth pursuing and whether growth is actually contributing to overall profitability (not just volume).
Rather than being tied to theoretical constraints, MR in practice is used on a case-by-case basis to help businesses assess performance and make informed decisions based on sales and campaign data initiatives, as well as other key data points.
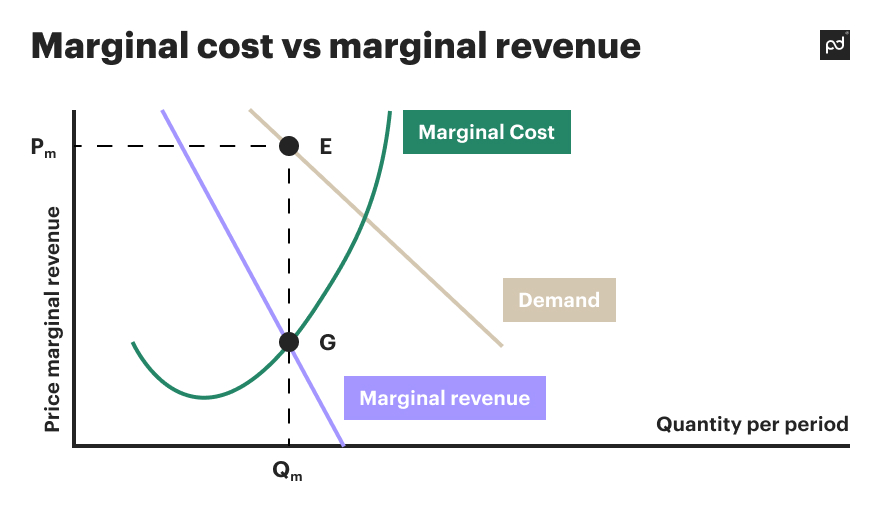
What’s the difference between marginal revenue, marginal cost, and average revenue?
These three sound similar, but they’re actually set up to measure very different things.
-
Marginal revenue measures the additional revenue earned from selling one more unit of a product or service.
-
Marginal cost is the additional cost incurred from producing one more unit.
-
Average revenue is the total revenue divided by the number of units sold.
These metrics work closely together to inform pricing and production decisions. For profit to grow, marginal revenue must exceed marginal cost. Average revenue gives you a broad overview of performance, but marginal revenue gives you insight into whether your most recent sales are still profitable.
Brands trying to maximize profits will need all three metrics to ensure that earned revenue equals, at a minimum, the production costs and overhead required to sell and support a product or service.
Why is marginal revenue important for profit maximization?
At its core, calculating marginal revenue helps businesses know whether selling additional units of a product will actually generate more money.
While it might seem like revenue increases with additional sales, that isn’t always true due to the cost of production — called the marginal cost — when making additional products. How these two metrics align with one another is something like this:
-
Marginal profit is calculated by subtracting marginal cost from marginal revenue.
-
If marginal revenue exceeds marginal cost, you’re making more revenue than the unit costs to produce, so you can keep selling.
-
If marginal cost exceeds marginal revenue, you’re spending more to sell than you’re making back, so you’re selling at a loss.
Knowing MR allows teams to compare production costs to overall profits and make a decision about whether it makes sense to continue selling a product or service. In this way, businesses can avoid chasing volume over value.
Example: You’ve sold 10 pairs of shoes for $100 apiece, but you actually have 500 pairs of shoes in your warehouse.
You need to sell more shoes, but you’ll need to lower the price to do it because buyers aren’t interested in paying $100 for your shoes.
Lowering the price is likely to increase demand, but it also lowers your MR. Depending on how you do it (sale, price reduction, rebate, etc.), calculating your MR might not be straightforward.
At the same time, it costs $55 to make each pair of shoes. This is your marginal cost, so your average price needs to exceed production costs in order to make a profit. Now, you’ll need to decide whether to lower your price and accept slimmer margins, pull the product from shelves, or wait and see if buyer demand rises on its own over time.
You’ve probably noticed that MR is only one part of the equation. To calculate something like marginal profit, you’ll still need to know your production level and the overall cost it takes to produce an additional item. Once you have the data, MR becomes a powerful filter for decision-making.
Bottom line: If the selling price generates MR that exceeds production costs, every sale contributes to profit. If not, you’re losing money and wasting resources.
Unfortunately, real-world competition and pricing interfere with these simple equations, which is why MR becomes more useful. If a company offers aggressive discounts or runs expensive promotions, shaving profitability off the top will likely increase consumer demand while lowering the MR per unit sold.
Additional costs related to manufacturing can also rise over time. When this happens, the window of profitability for a given product or service grows smaller due to the expenses required for an additional unit of production.
Based on MR calculations and how they compare to production costs, a company might choose to remove a product from its catalog entirely or pull it from shelves until an increase in market demand allows the product or service to be sold at a higher price. (This is a common approach for seasonal items, where market demand slumps in the off-season.)
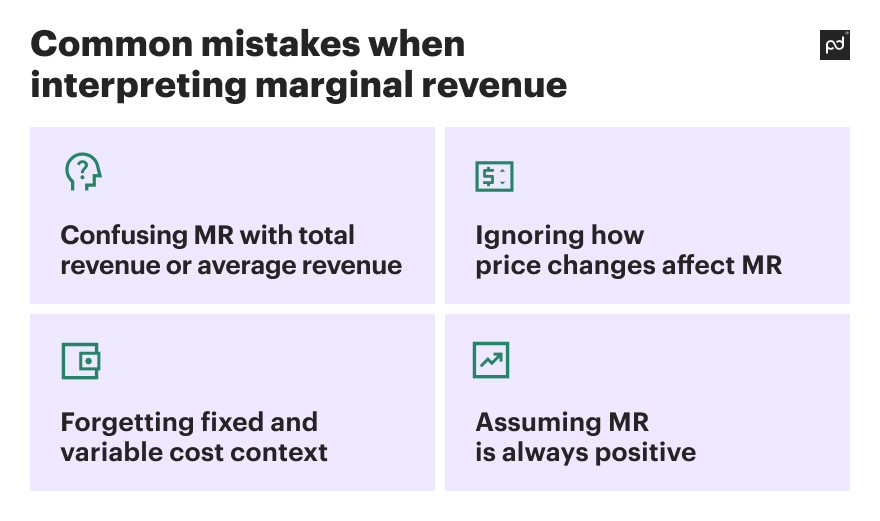
Common mistakes when interpreting marginal revenue
While MR is a simple concept on the surface, it’s easy to misinterpret when applied to real-world business scenarios.
Here are some of the most common mistakes companies make when working with marginal revenue.
Confusing MR with total revenue or average revenue
One of the most common mistakes is assuming that marginal revenue is just another way of saying “total” or “average” revenue. However, this isn’t true.
-
Total revenue is the full amount you’ve earned from all sales combined.
-
Average revenue is the total revenue divided by the number of units sold.
- Marginal revenue is the revenue earned from selling one additional unit of a product or service.
Although these metrics are related, they aren’t interchangeable, and mistaking one for another can lead to flawed forecasting, mispriced products, or incorrect assumptions about profits.
Of the three, MR gives the most current insight into short-term profitability. Where both total and average revenue give better long-term projections, MR can help you project short-term profitability based on the numbers from your most recently sold units.
Ignoring how price changes affect MR
If you change your price to drive sales through a discount, promotion, or negotiation, you’re affecting MR whether you realize it or not.
Many businesses lower prices to increase volume without calculating whether additional units sold are actually contributing to profit. If MR drops below your total cost per unit — including production, shipping/delivery, and warehousing — you’re losing money on every extra sale, even if total revenue is going up.
This is especially easy to overlook in fast-moving and competitive sales environments, where companies rush to counter the price elasticity of demand by lowering prices to keep buyers engaged.
Forgetting fixed and variable cost context
Marginal revenue only tells one side of the story. If you’re not also considering the marginal costs, you won’t have a full picture of your production expenses. Variable costs like materials, labor, packaging, or shipping are also critical for these calculations because they influence the cost of production.
One common mistake is to assume that you’re automatically more profitable because you’re earning more money. But fixed costs like rent or software subscriptions don’t scale over time the way that variable costs will.
Example: Assume you charge $1,000 each year for a service subscription.
Through metrics and tracking, you can see that the average cost required to onboard and support a customer year over year is $500. This is a combination of required staff support, ongoing product development and maintenance, etc.
However, next year, both your facilities and labor costs increase. Now, it costs $575 to support a customer. Even though you’re still making money (MR is flat), the “floor” for profitability has risen in ways that won’t appear in financial statements or earnings reports.
If your variable costs increase over time but the cost of your final products remain the same, profits can disappear even though revenue continues to rise on paper.
Assuming MR is always positive
In reality, marginal revenue can fall to zero or even go negative.
This usually happens in saturated markets or when steep discounts are used to chase sales. If you’re lowering your price aggressively in order to move units, it’s possible that revenue from those extra sales is lower than the revenue you would have earned by selling fewer units at a higher price.
In extreme cases, you might move more product but make less money overall. That’s a dangerous outcome if you’re not actively tracking the impact of your pricing strategy by revenue generated per unit.
Marginal revenue strategies to maximize profit
As a metric, marginal revenue isn’t that useful by itself. It begins to have a strategic impact when used alongside other data points, pricing insights, and business intelligence.
When used in that context, marginal revenue can play a role in fine-tuning your pricing, aligning production goals with sales goals, and helping to grow your profit without sacrificing overall value.
Let’s take a closer look at how you can use MR values to generate additional profit
Pricing tactics
Marginal revenue plays a central role in shaping effective pricing strategies. By analyzing how pricing and revenues change when additional units are sold, businesses can make better decisions about when to discount, how to bundle products, or how to price offerings based on demand.
For instance, dynamic or “surge” pricing allows competitive firms to adjust prices in real time when responding to market conditions, maximizing revenue when demand is high while remaining competitive when demand softens. Especially when pricing is automated, tracking MR over time and analyzing those outputs can help businesses understand when and how current pricing solutions balance cost and demand.
Similarly, bundling or volume-based pricing can increase transaction size without significantly increasing cost. Upselling or cross-selling strategies can also increase the value of a sale while keeping costs relatively low. By using marginal revenue as a performance metric, teams can assess the return on each deal, monitor pricing effectiveness, and ensure reps are delivering value that aligns with revenue goals.
Production optimization
Marginal revenue is also a key input when evaluating how much of a product the company should produce.
Businesses can use it to determine whether producing and selling additional units of output will result in more profit, or if the cost curve conflicts with any marginal benefit that the company might receive. When marginal revenue exceeds marginal cost, producing more units typically leads to higher profits. But if marginal costs begin to creep up due to supply chain issues, labor costs, or equipment constraints, then continuing to produce the same level of output may no longer make sense.
In this case, understanding marginal revenue helps teams to know when to scale up production, when to hold steady, and when to pull back in order to protect margins and avoid wasteful overproduction. Without monitoring MR, these insights may only reveal themselves in financial statements, where it becomes obvious that generated revenue may not justify long-term production costs.
Customer segmentation
Not all customers behave the same way when it comes to pricing. Marginal revenue can help identify how different market segments respond to changes in price.
Some customer groups are highly price sensitive and will only convert when the price drops. Others are more focused on quality, convenience, or brand loyalty and will pay a premium without significant impact on demand. Marginal revenue analysis helps businesses tailor their pricing and promotional strategies to these differences, allowing brands to offer discounts or incentives only when necessary to capture higher margins.
For example, in SaaS industries, offering tiered plans or usage-based pricing allows businesses to extract more value from high-usage customers without overextending resources. By aligning price strategy with the budgeting and behavior of each customer segment, a business can improve margins and overall revenue efficiency.
Put your revenue strategy into motion with PandaDoc
Marginal revenue might seem like a simultaneously pointless and insightful metric, especially if you’re only using it in a theoretical sense. When paired with production costs, pricing strategy, or real customer behavior, or additional metrics, it becomes a powerful figure to assist with profitability.
Calculated and considered correctly, MR can help you spot where growth is truly beneficial and where selling more may actually hurt your bottom line. By applying this sort of thinking across an entire operation, businesses can fine tune strategies and make smarter decisions about when to push forward, when to hold back, and where to focus to achieve greater returns.
PandaDoc helps growing teams put these strategies into action with powerful CPQ solutions. Our platform makes it easy to build complex pricing models, customize quotes for different customer segments, and adjust pricing dynamically without slowing down your sales cycle. By streamlining your quoting process and giving your teams more control over how deals are structured, PandaDoc CPQ helps to ensure that MR stays high, costs stay predictable, and profitability stays on track as you scale
Ready to see how it works? Book a demo with one of our product specialists to see how PandaDoc can give you all the tools you need to streamline your end-to-end sales process.
Disclaimer
PandaDoc is not a law firm, or a substitute for an attorney or law firm. This page is not intended to and does not provide legal advice. Should you have legal questions on the validity of e-signatures or digital signatures and the enforceability thereof, please consult with an attorney or law firm. Use of PandaDoc services are governed by our Terms of Use and Privacy Policy.
Frequently asked questions
-
Marginal revenue and price elasticity are closely connected.
Price elasticity measures how sensitive customer demand is to a change in price.
If demand is elastic, a small price drop can lead to a large increase in quantity sold, which increases revenue generation and keeps MR high. This is also known as positive marginal revenue, because revenue/profits are still increasing as more units are sold, despite the lower costs.
If demand is inelastic, lowering the price won’t significantly increase sales volume. As a result, MR drops heavily because of the steep discounts required to prompt user action. This leads to negative marginal revenue because, while units are still being sold, the profits aren’t high enough to cover the manufacturing costs and related overhead.
Understanding this relationship helps businesses predict how price changes will affect both revenue and customer behavior.
-
In some scenarios, yes. This usually happens when lowering the price to sell more units causes a larger drop in overall revenue.
For example, if the price cut applies to all units sold and the gain in volume doesn’t offset the loss in price, the revenue from extra units may not be enough to justify the cost of production, upkeep, and overhead required to sell and support the product.
When this happens, it’s a strong indicator that you’ve passed the point of profit maximization and need to reevaluate your pricing or sales strategy.
-
Often, but not always. As a business lowers its price to sell more units, marginal revenue decreases due to diminishing returns.
In a theoretical scenario, this makes perfect sense. Lowering the cost allows for the sale of additional units, so the number of units sold steadily increases while the marginal revenue gained per sale decreases.
In a real-world scenario, things are a little different because of the other factors related to the sale (pricing, discounts, bundles, multiple sales channels, etc.).
If pricing is stable or if a business is able to upsell or bundle effectively, MR can remain steady or even increase temporarily. However, most of the time, MR will gradually decline as more units are sold, especially when price reductions are needed to drive additional sales.