Customer success metrics are the bread and butter of the SaaS industry, especially when it comes to business operations.
In many cases, all aspects of the business — from product expansion to feature development — revolve around customer metrics and feedback.
Sometimes, this is great.
Customer insights can help you improve your product and get a better understanding of what features are most important to users.
Trackable metrics can provide early warning signs that things aren’t going as planned and signal the need for change.
In this article, we’ll take a look at 7 customer success metrics that you can use to improve your SaaS business.
1. Net Promoter Score (NPS)
NPS is designed to use customer experience as a predictor of satisfaction and future business growth.
For SaaS companies, this can be an ideal metric for measuring customer relationship. NPS is calculated on a 0-10 scale and groups respondents like so:
- Promoters: Scored 9-10. These individuals gave you very high marks. They love your brand, will continue to buy your product, and are likely to talk positively about it to others.
- Passives: Scored 7-8. This group is satisfied with your product, but they’re not excited about it. They won’t enthusiastically endorse it in the same way that a promoter would, and they’re more likely to be pulled away by competitive offers.
- Detractors: Scored 0-6. These customers are unhappy. They might stay with your company until a better offer comes along, but they don’t enjoy the experience, and they definitely won’t endorse you. In fact, they can negatively damage growth by speaking out about their experience.
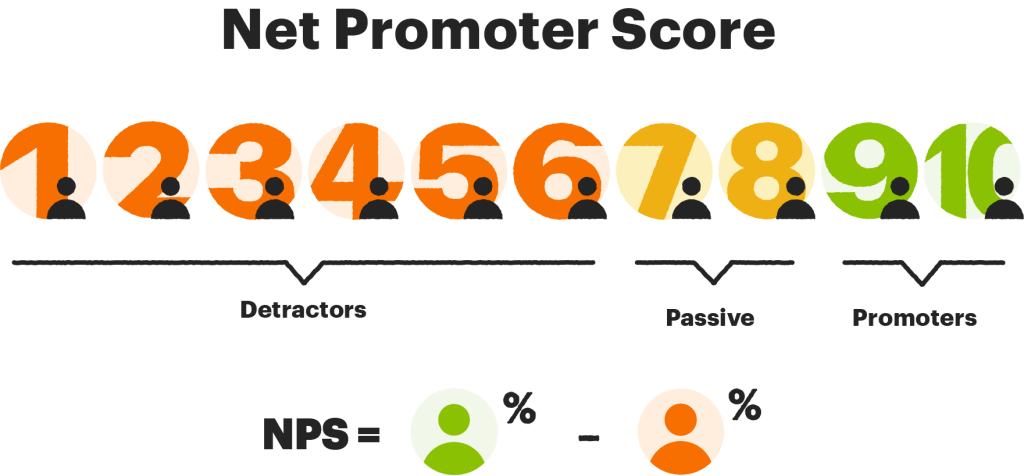
To calculate your total NPS score, subtract the percentage of detractors from the percentage of promoters. (This score can have a negative value.)
Making it actionable
NPS has been used by everyone from Fortune 100 brands all the way to small businesses trying to better understand customer needs.
However, as a KPI, it’s easy for this to become more of a vanity metric than an action item if you don’t pair it with other data points.
To get the most out of NPS, do the following:
- Place your NPS survey in a location where it will receive a high response rate. You could do this via an in-app survey, a post-purchase email, or something similar.
- Include an open-ended question or text box in your survey so that users can type out longer responses and provide additional feedback. Most customers won’t participate, but some will, and these insights can be extremely valuable.
- Pair the response with user analytics and customer data to get a better understanding of the user’s customer journey. How do they use your software? What for and how often?
- Follow up with respondents. Some companies focus solely on detractors while others call everyone. Just getting in touch with customers can help you learn more about their unique situation and help you gain additional insights into how you can move the needle for their unique experience.
As you can see, NPS becomes most actionable when you use it to engage with your customers directly and solicit feedback based on their user experience.
These callbacks and touchpoints aren’t a chance to upsell your customer base or justify the company’s actions. All you have to do is listen, take notes, and learn from what your customers are trying to tell you.
The ability to do that, along with the simplicity of the NPS survey, is what makes this metric so valuable.
If you haven’t created an NPS survey yet, you can do that using PandaDoc Forms. Create the form, embed it on your website, and send a link to customers to fill it out. All relevant information is automatically compiled in Forms.
2. Customer Satisfaction Score (CSAT)
CSAT is typically used to measure how satisfied a customer is with a product, service, or interaction.
It’s a scaleable metric that can be used to gauge the quality of small transactions or encourage customers to give opinions on their view of the business as a whole.
Like NPS, CSAT is a simple metric that is easy to capture (even as part of a larger feedback survey) and simple to calculate.
To gather the data, you’ll need to ask the following question:
How satisfied were you with your experience today?
Give customers a fast and easy way to rate their experience from worst to best. Typically, this is done with a 0-10 scale or something similar.
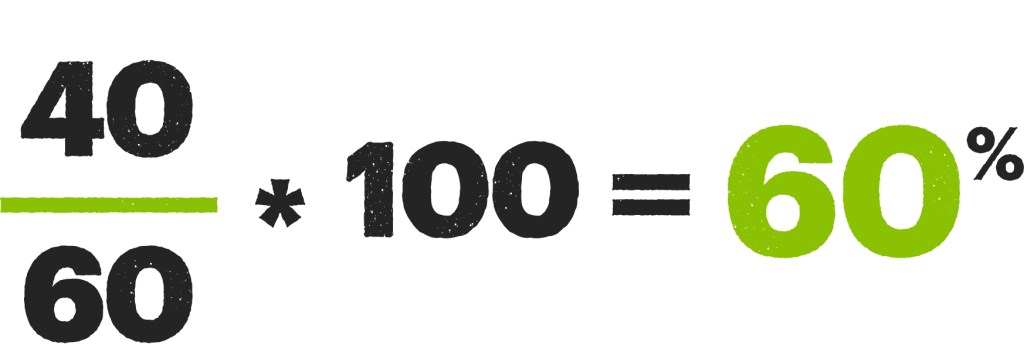
To calculate CSAT, divide the number of positive responses by the total number of responses and multiply by 100. (Example: 40 positive responses / 60 total responses X 100 = 67%)
Making it actionable
Getting the most out of CSAT comes down to asking specifically what you want to know about.
Because of this, CSAT can be deceptive. It’s possible for customers to love a product but dislike the price or to enjoy a product but dislike a brand.
CSAT is best utilized to gauge the customer’s satisfaction with a specific product, service, or process. Because of this, CSAT works best when your questions are clear so that you can avoid confusion during customer feedback.
When creating product survey forms or customer experience surveys, be precise with your questions to avoid ambiguity. Without taking these steps, both the quality and authoritativeness of this metric become far less valuable.
If your customer success teams can’t understand why someone is dissatisfied, it will be much harder to use CSAT to reduce customer churn rates and improve the customer experience.
3. Customer Effort Score (CES)
CES is designed to measure how much effort a customer must exert in order to use your product and resolve problems.
This is a critical metric for your userbase because it has a direct impact on user loyalty. The harder customers have to work in order to overcome obstacles and use your software to get results, the less likely they are to stay.
Your support team will play a critical role in influencing this metric since they often act as the main point of contact for customers who are having issues.
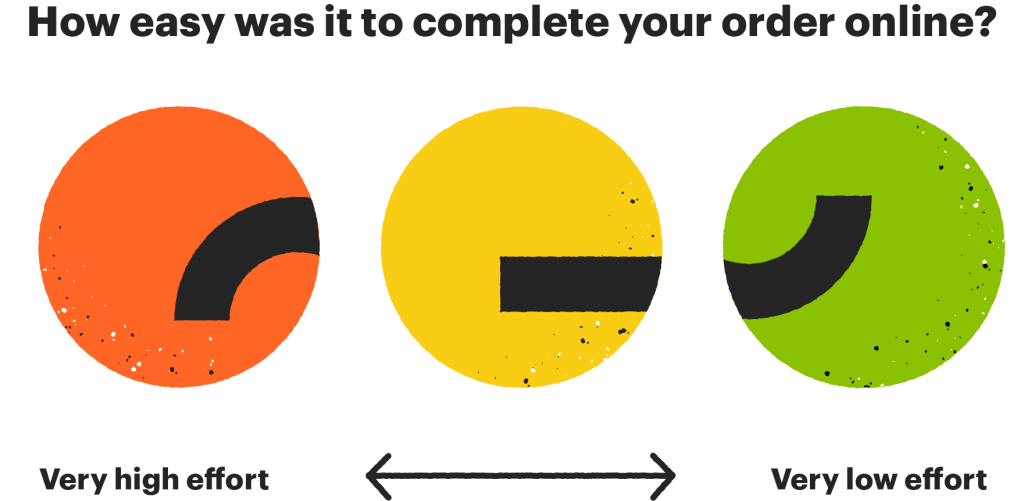
To get the data you need, send a post-support survey to your customer asking how easy it was to resolve their issues.
Give customers a simple 0-5 or 0-10 scale to submit their answers. You can also provide a list of answers from “Very Hard” to “Very Easy,” but these verbal scores need to be ranked numerically on the backend.
CES is calculated by dividing the sum of all customer scores you receive by the total number of survey responses.
For example, imagine you were scoring CES on a 7-point scale. If you received a total of 10 responses and eight of them were 7/7 while two were 6/7, your CES would be calculated like this: (8*7)+(6*2) / 10 = 6.8 out of 7 (max).
Making it actionable
While CES is a powerful and important metric, you’ll need to take care with how you collect your data when trying to calculate it.
Because CES can be used to calculate everything from product interactions to support issues, it’s only a great benchmark as long as you have a good idea of what you want to measure.
Asking how easy it was to resolve an issue after a customer support call may give you great insight into your support process, but that’s only one part of the customer experience. That score wouldn’t tell you how much effort a customer exerts when using your product on a daily basis.
To leverage CES in the most effective way, select a customer process that you’re interested in measuring and assign a survey trigger to it. When customers use a specific feature or interact with the product in a specific way, ask them about their experience.
Measure your results and take appropriate action.
Remember: Customers are looking for software that helps them accomplish their goals. They aren’t looking for software that is more trouble than it’s worth.
Software with high functionality, speed, and simplicity can be more readily adapted into a customer’s business model and can even boost their total revenue.
Rolling out fixes and initiatives that help customers overcome these issues will result in increased customer loyalty and referrals, so long as your software continues to fulfill a niche and remains easy to use.
But when customers have to fight with slow, clunky systems or navigate through complicated menus just to access necessary features, that expended effort can stall product usage and lead to churn.
4. Churn Rate
Churn, or the rate of attrition, is a measure of how often customers stop doing business with a company over a specific period of time.
Of all the metrics on our list, churn is probably the most often talked about in the SaaS space — and with good reason.
Churn often represents the darker side of client retention. As customers try out new products or find solutions that more readily fulfill their needs, they will drop subscriptions for software tools they don’t use.
For SaaS companies, churned customers have a profound impact on monthly recurring revenue, customer lifetime value, customer acquisition cost (CAC), and many other metrics. It’s also a key metric for startups looking for venture funding or acquisition.
As a result, it’s critical to properly analyze and understand your results.
To calculate churn: divide [the total number of customers you had at the start of the month] by [the total number of lost customers at the end of the month] and multiply by 100.
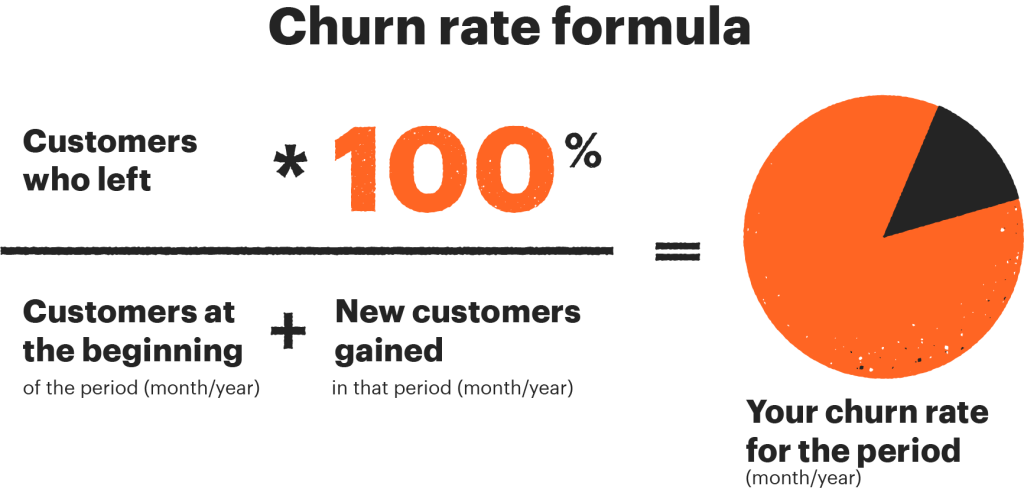
For example, if you had 250 customers at the start of the month and you lost 20 by the end of the month: 20/250 = .08 x 100 = 8%.
This calculation also has a direct impact on revenue churn (revenue lost / total revenue), since customer churn — including plan downgrades — will directly affect how much your company earns month over month.
Making it actionable
Churn can serve as a metric for performance within a given month, but it isn’t the be-all-end-all metric that many CEOs and investors make it out to be.
Consistent churn over a long period can give you key insights into the customer lifecycle that you can try to circumvent by introducing new features or actively reengaging with customers as they near anticipated offramps and endpoints.
Most SaaS companies actively seek to soften the effect of churn by rewarding annual subscriptions with steeper discounts when compared to month-to-month options with higher prices.
If you’re moving in that direction, you may be able to use other metrics, like user activity, to determine when customer engagement wanes.
Flag those users are potential flight risks and work to engage them through the rest of their subscription cycle.
In almost every case, customer retention costs (CRC) are lower than customer acquisition costs, meaning that dollars spent keeping existing customers are better used.
While onboarding new customers will always be important, how you engage with existing customers to provide continual value over time, both in product offering and in customer service, is more likely to affect your churn rates.
5. Average Revenue Per User (ARPU)
ARPU is a measurement of how much money a single customer generates for your business.
This includes all revenue generated over time by plan upgrades, add-ons, cross-sells, renewal rates, downgrades, and more. This metric is used in SaaS companies to model and predict growth over time.
Knowing how much money an average user is likely to spend can give you great insights into the revenue you’re likely to earn with each new signup and how that’s likely to evolve over time.
To calculate ARPU, divide the total revenue of your business by the total number of customers you’ve had in a given duration.
For example, if your company made $50,000 last month and you had 1,000 users on your platform, 50,000/1,000 = $50 per user.
Making it actionable
Knowing your ARPU can help you better understand how to scale your business.
If you know that your ARPU is only $40 or $50, then you’ll need to drastically scale the number of active users on your platform in order to grow. That’s different from a company where the ARPU is $1000 per user, where the focus might be on customer retention rather than scaleable growth.
Combined with other metrics, like churn rate and CSAT, you can also use ARPU to better understand how and when customer interest in your product wanes and when customers are likely to churn.
Measure ARPU can also open up some interesting opportunities with expansion revenue. As you introduce new products and features, encouraging active customers to upgrade plans or purchase add-ons may increase ARPU.
This metric can also play a major role in determining plan prices. If your ARPU is too low compared to the value of the product you want to sell, raising your prices to a competitive market value can help you increase ARPU while still maintaining a strong market position.
6. Monthly Recurring Revenue (MRR)
MRR is the total amount of predictable revenue that your company can expect to receive on a monthly basis.
For SaaS companies, the majority of MRR will come from monthly subscriptions. This number becomes more stable as users are pushed away from monthly plans and more toward annual subscriptions.
However, you can get more technical with this metric by breaking MRR down into five basic types:
- New. MRR from new signups.
- Expansion / Upgrade. MRR from existing customers who choose to upgrade their service (new plan tier, additional seats, add-on services, etc.)
- Reactivation. MRR from previous customers who return to the platform.
- Contraction / Downgrade. Lost MRR from customers who are downgrading their plan to a lower tier, reducing headcount, etc.
- Churn. Lost MRR from customers who abandon the platform.
Having a strong pulse on MRR is a great way to understand revenue churn and how your cash flow works. Measuring by the five points above will also help you to better understand the customer lifecycle.
To get a rough calculation for MRR, multiply ARPU by the number of monthly subscribers.
For customers on annual plans, don’t forget to divide their plan fees by 12 before including them in your monthly calculation.
Making it actionable
MRR is a great metric to track because it’s easy to calculate and great at forecasting revenue.
Because most SaaS companies track performance on a monthly basis, MRR gives an accurate estimation of cash flow over a period in which most other key metrics are tracked.
From a financial perspective, MRR gives a reasonably accurate estimate of the cash flow you’re likely to see each month, which can help with budgeting and spending, both of which are useful for maintaining regular operations.
7. Customer Lifetime Value (CLV)
CLV (sometimes CLTV or LTV) estimates how much money you can reasonably expect from a single customer. In essence, it’s the monetary value of your relationship with the customer.
If you’re looking for a metric that can accurately measure how much a single customer is worth, this is it. And, because it’s much more cost-effective to retain customers rather than acquire new ones, driving this number as high as possible is critical to long-term success.
Calculating CLV is tricky, and it needs to be done in three separate parts:
- Calculate the average customer purchase value
- Calculate the average customer lifespan
- Multiply average value by average lifespan
Because the customer lifecycle can fluctuate from user to user, CLTV is calculated using averages.
If you’re a startup, making these calculations can be tough when you don’t have enough data on your end-to-end customer lifecycle. If you’re new and working with a relatively small sample size, CLV will be skewed.
This is especially true if you lack the lifespan data required to accurately measure how much time customers spend on your platform.
If you find yourself in this situation, be patient. Churn will ensure that you have enough calculable data within a few months.
Making it actionable
CLV is a great way to measure customer success over time. Customers who find more success with your platform are likely to use it longer.
High churn rates, along with low NPS or CSAT, will ultimately lower CLV as users abandon the platform for greener pastures, so fluctuations in CLV can give you a bird’s eye view of overall customer health.
As you get a clear understanding of CLV, it also becomes more useful in accurately predicting how much revenue you can expect to earn from new customers and signups.
This is particularly helpful when trying to model growth and consumer behaviors around transactions and purchases.
Combined with some of the other metrics on our list, CLV can also act as a great indicator for when customers might be reaching their end of life, allowing you to build retention strategies to further extend customer lifespans.
Better customer health scores with PandaDoc
At the end of the day, all of these metrics are really just ways to get a better understanding of whether your customers are healthy and happy or whether they’re likely to abandon your platform for competitors.
Information like this is critical for customer success managers who want to close the loop between customer experience, support, and satisfaction.
But it often starts with asking customers the right questions.
If you don’t have a great way to gauge the customer experience yet, PandaDoc can help. Our form creation tools make it easy to create your own NPS survey.
Ask questions to gauge CSAT or send forms after resolving a support question to better understand the effort (CES) that customers are putting in.
Sign up for a free 14-day trial to get started and see how PandaDoc can help you build a better customer experience.