Review and track document analytics
Finish your demo booking
Looks like you haven't picked a time for your personalized demo. Pick a time now.
Select date and time
Streamline your business processes with automated audit trails and tracking for every document in your workspace.
No credit card required


Document tracking helps users monitor and manage the status of a document throughout its lifecycle.
As documents move through drafting and approval processes and are finally sent to intended recipients for review and e-signature, document tracking can keep you informed every step of the way.
With PandaDoc, document tracking is part of a larger document ecosystem. Users can create documents from scratch, send them to intended recipients, capture e-signatures and payment, and store completed documents in a dedicated repository.
The best part: PandaDoc can handle all aspects of the document lifecycle, so you never have to leave the platform.
Tracking begins when documents are created. Changes are automatically logged in the document audit trail.
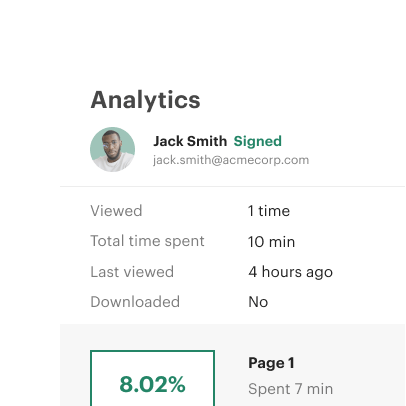
Use analytics to understand how stakeholders interact with each page of your proposals and contracts.

Leverage analytics data to build better templates, improve document workflows, and close deals more quickly.
Say goodbye to document tracking spreadsheets!
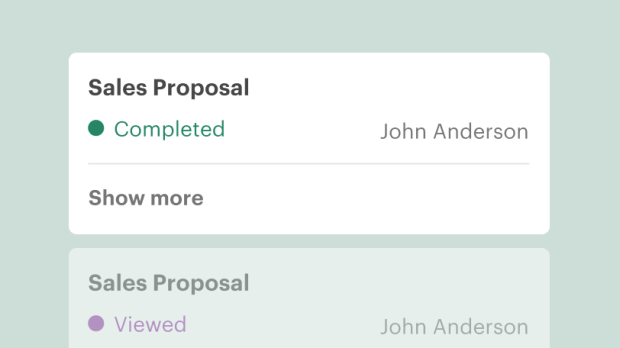
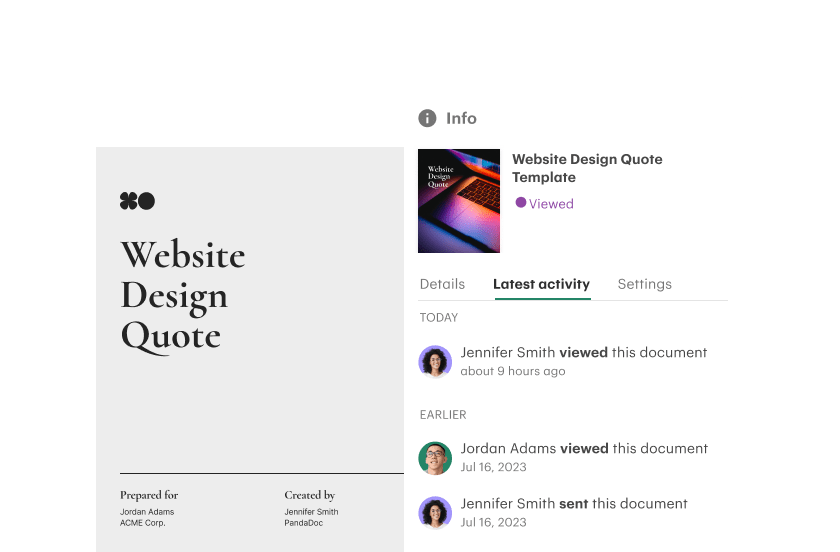
Every PandaDoc document includes a real-time dashboard that shows what changes have been made in a document throughout its entire lifecycle.
Learn when documents are created, viewed, changed, sent, and signed all in one place.

Gain key insights into how your documents are handled via cutting-edge tracking tools.
See which parts of your contracts and proposals get the most and least engagement, then use those details to optimize your templates for even better performance.
Test the results of your changes with a new set of documents, and repeat.
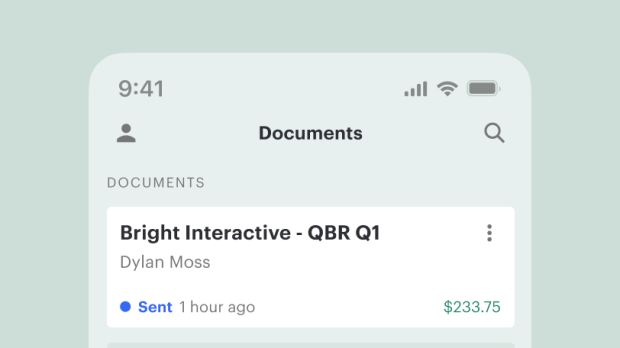
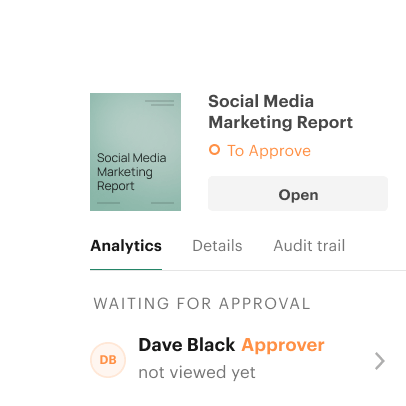
Learn when and how document status changes.
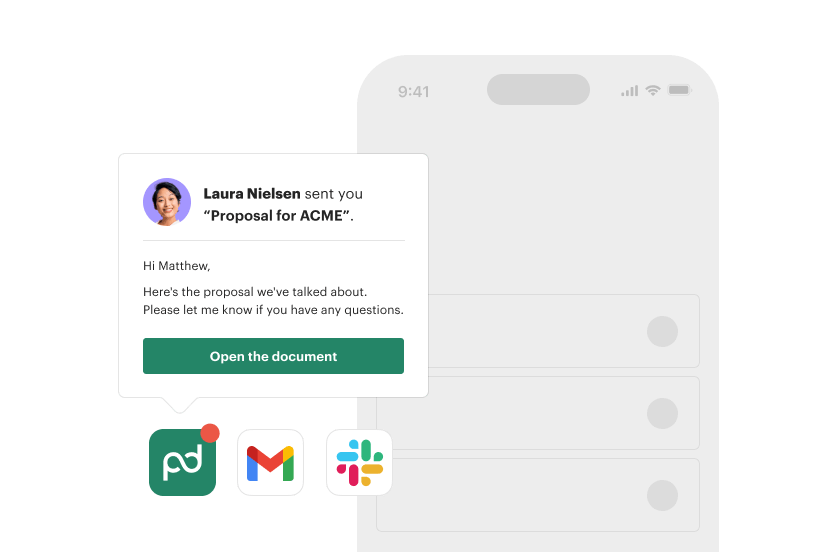
Leverage onboard sales document tracking to learn when documents are opened and completed by recipients.
Stay on top of your documents and know exactly when it’s time to follow up.
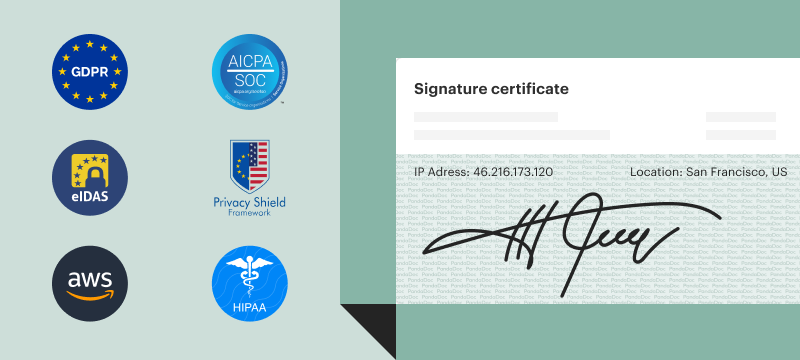
Automatically defend against non-repudiation with an auditable record of all user activity inside a document.
Ensure contract validity and protect confidential information for every sent document.
Offer unique, digital certificates upon e-signing to ensure document validity and authenticity.
Consult a detailed list of changes using onboard version control and document tracking systems.
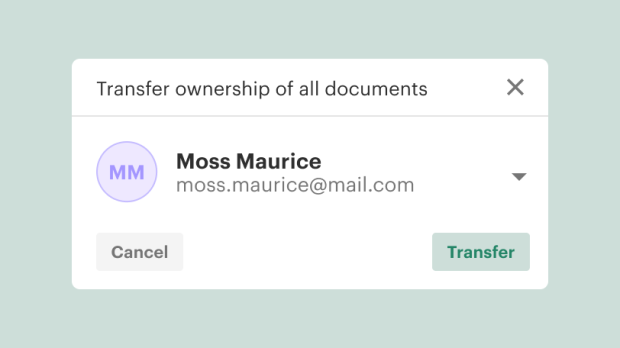
Learn what changed, and who interacted with your documents. Keep out unwanted guests by using permissions to restrict document access.
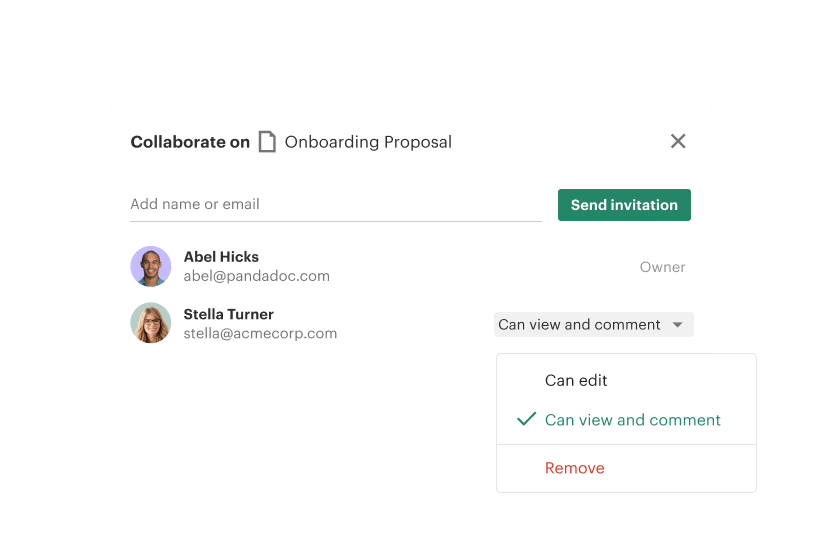


Use document sharing and tracking to review team actions when collaborating on a proposal.
Learn who has accessed and edited specific documents, as well as when and where those changes were made.
Tracking these changes and inputs can help teams create more accurate and beneficial proposals between project stakeholders.

Stay safe when handling confidential information for any type of document.
Online document tracking can be used to improve regulatory compliance and minimize risk by ensuring that unauthorized access is discovered and quickly limited.
This is critical when handling sensitive information or adhering to regulatory compliance standards (HIPAA, GDPR, etc.).
Get email notifications when a customer views or signs your quote.
Improve deal retention by engaging in customer follow-up and Q&A when leads are active and information is fresh.
Analyze quote performance and combine that data with tracked win rates to optimize your pricing and engagement strategy.
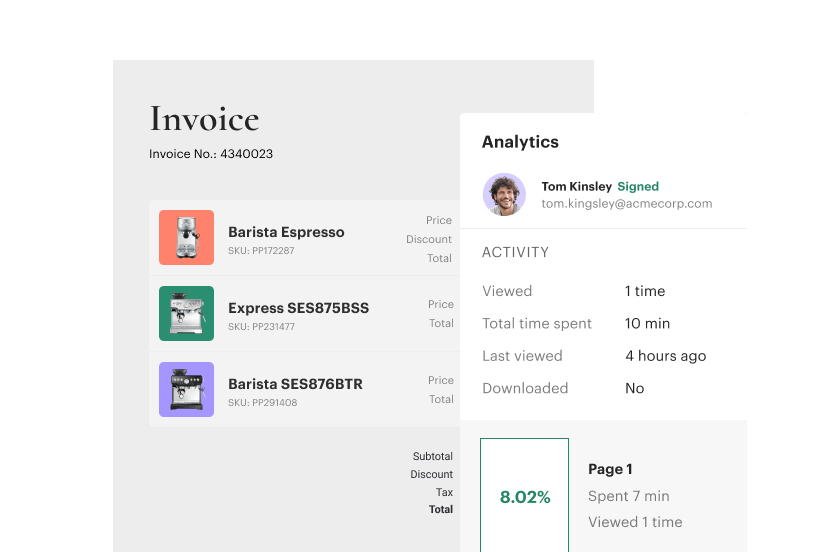
Streamline invoice management by tracking invoice status and visibility.
Get notified when recipients access invoices. Monitor activity and send reminders to ensure timely payments without adding manual effort.
Get personalized 1:1 demo with our product specialist.
By submitting this form, I agree that the Terms of Service and Privacy Notice will govern the use of services I receive and personal data I provide respectively.
While some companies may charge extra for DTS services, PandaDoc offers document tracking as part of any standard pricing plan.
This key feature automates document tracking and the integrated functionality helps to ensure authenticity for every type of document.
Industry leaders often import CRM data from Salesforce or HubSpot into PandaDoc and use the platform to prepare and send documents.
When that happens, documents stay within PandaDoc, and any activity related to that document is automatically tracked.
During document creation, it’s possible to export PandaDoc files as PDF or DOCX. If documents are downloaded from the platform and sent as an attachment, PandaDoc won’t be able to log user activity.
The document tracking feature includes the following statistics: times viewed, total time spent, last view, PDF download, and if any links were clicked.
Additionally, team members will be able to see when a document status was changed, both through manual action and through automated functionality, such as e-signing a document to complete it.
Document reminders can be set within the document menu to send automatically on a weekly basis or prior to a predetermined expiry date.
It’s also possible to send manual reminders to individual recipients in order to prompt a follow-up or notify stakeholders of a document change.